Data Visualization with Dashboard
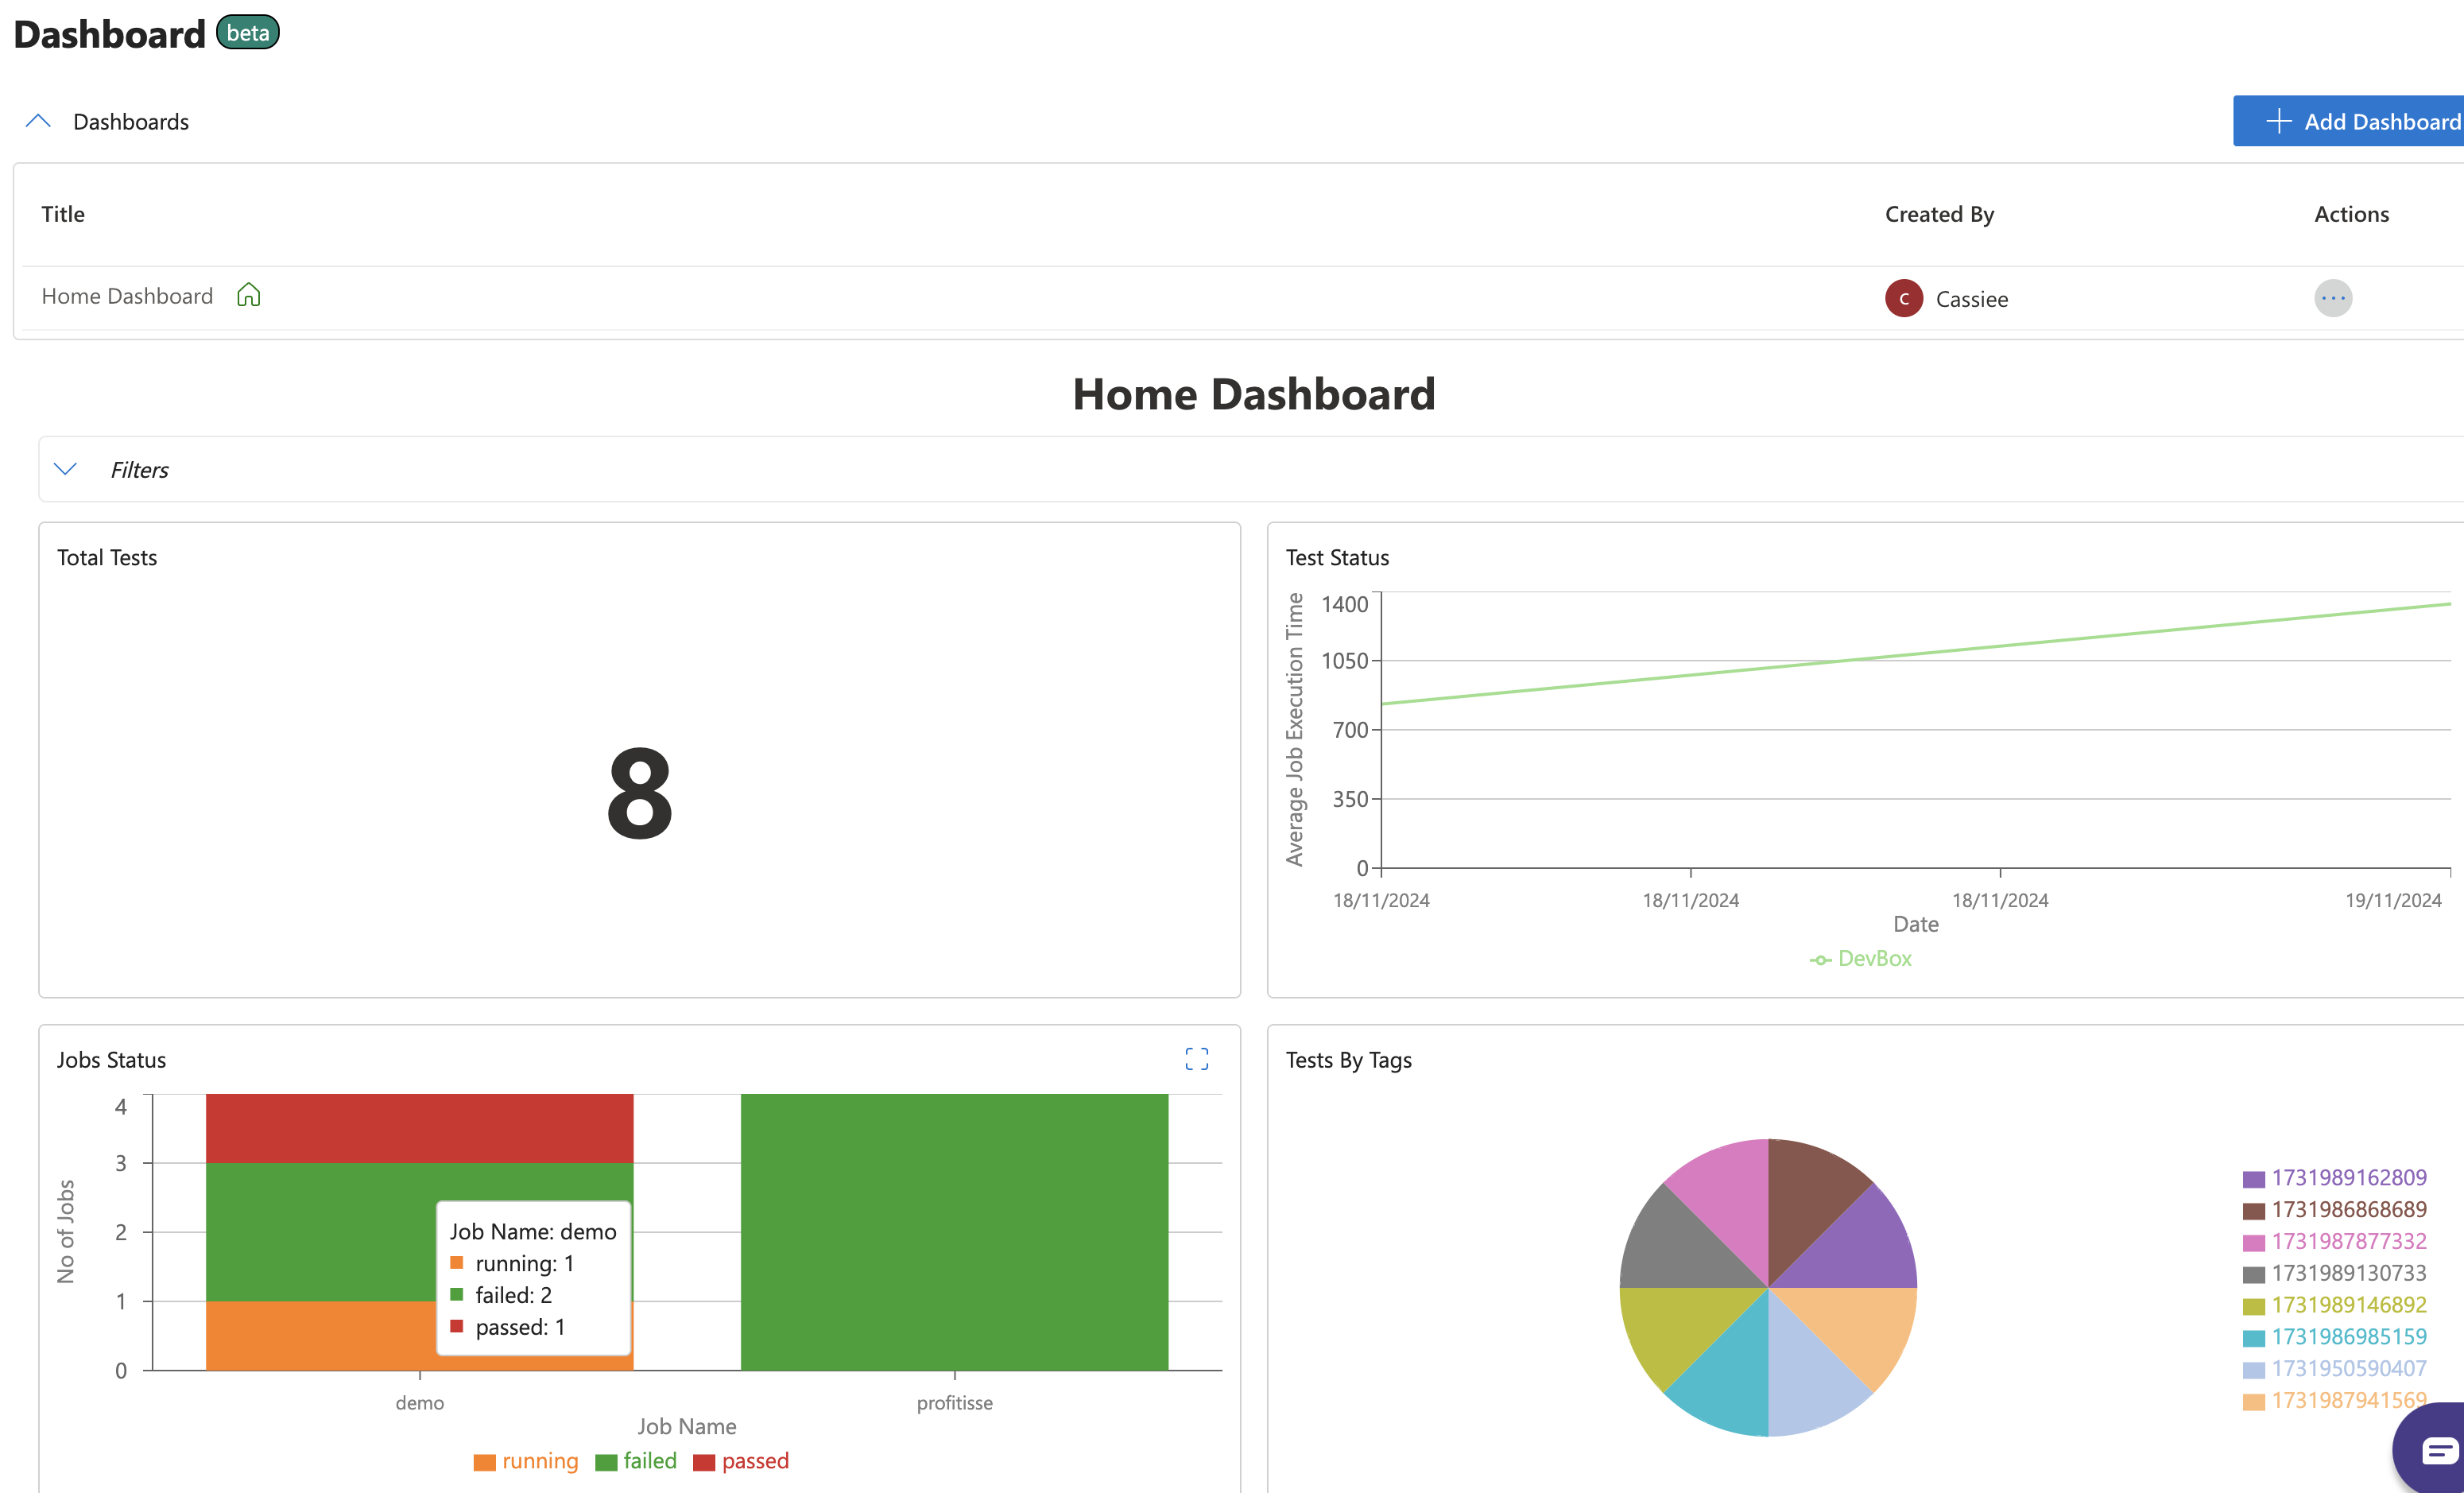
The Dashboard feature in DevAssure offers a highly flexible and customizable platform for data visualization. Users can dynamically create tailored dashboards with various chart types to effectively represent their data. These dashboards enable real-time monitoring and analysis of test execution data, providing a centralized view of testing activities.
This comprehensive overview delivers valuable insights into test performance, execution metrics, and overall project health.

Getting Started with Dashboard
-
Log in to the DevAssure Web Application
-
On the left navigation menu, click on "Dashboard"
-
Upon accessing the Dashboard section, the Home Dashboard is displayed by default.
-
This dashboard includes pre-configured charts with insights into key metrics such as:
- Total Tests
- Test Status
- Job Status
- Tests by Tags, Priority, Feature
- Top 20 Slow Tests
-
Users can edit, remove, or customize these charts to suit their needs.
Create a Dashboard
Creating a dashboard involves adding a new workspace, defining its layout, and organizing charts for tailored data visualization.
- Click the "Add Dashboard" button in the top-right corner.
- A dialog box will appear, prompting you to create your new dashboard with a title. Enter a unique, descriptive title for your dashboard (e.g., "API Metrics," "Visual Testing Insights").
- Once created, the dashboard will appear in the list of available dashboards.
- Click on the newly created dashboard to open it.
- Use the "Edit Dashboard" button in the top-right corner to define the layout and organize charts.
- After making layout adjustments, click "Save" to finalize the dashboard.
Edit a Dashboard
Editing a dashboard in DevAssure allows you to update its layout, settings and manage permissions for who can edit the dashboard. By default, the project admins can edit dashboards, but you can update settings to grant or restrict access.
- Navigate to the "Dashboard" section and select the dashboard you want to edit.
- Click on the "Edit Dashboard" button in the top-right corner.
- Editing Permissions: By default, only admins can edit dashboards. To change permissions and define who can edit the dashboard include the usersand assign edit access to them.
- Layout Adjustments: You can also add or remove charts as needed to customize the layout.
- Click on "Switch to view Mode" after performing the edits.
Dashboard Actions
DevAssure allows users to update existing dashboards to keep them relevant and aligned with evolving project needs.
-
Modify Dashboard Title and Description:
- Locate the desired dashboard in the list.
- Click the ellipsis icon under actions and select "Update".
- Update the title or description to reflect new details.
- Save the changes.
-
Duplicate a Dashboard
Duplicating a dashboard is a quick way to reuse a layout or data configuration while creating a new version.
- Navigate to the dashboard you want to copy.
- Click on the "Duplicate" option in the actions menu.
- Assign a new name to the duplicated dashboard.
-
Set as Home
You can designate any dashboard as your default landing page for quicker access.
- Choose a dashboard you want as your default view.
- Under the actions menu, select "Set as Home".
- Confirm the selection.
The selected dashboard will now appear by default whenever you access the Dashboards section. This ensures that critical metrics or preferred layouts are immediately visible.
-
Delete Dashboard
Remove dashboards that are no longer needed to keep your workspace organized.
- Open the dashboard you wish to delete.
- Click the "Delete" option in the dashboard menu.
- Confirm the deletion in the prompt that appears.

Deleting a dashboard is a permanent action and cannot be undone.Ensure the dashboard is no longer required before proceeding.
Test execution data for the recent 45 days are only retained in dashboards.
By utilizing these features, users can effectively manage their dashboards to stay organized, enhance data accessibility, and maintain focus on project priorities.